Analytics + BI and Visualization
- Human eyes can process 36,000 visual messages per hour
- 90% of information transmitted to the brain is visual
- Visuals are processed 60,000 X faster in the brain than text
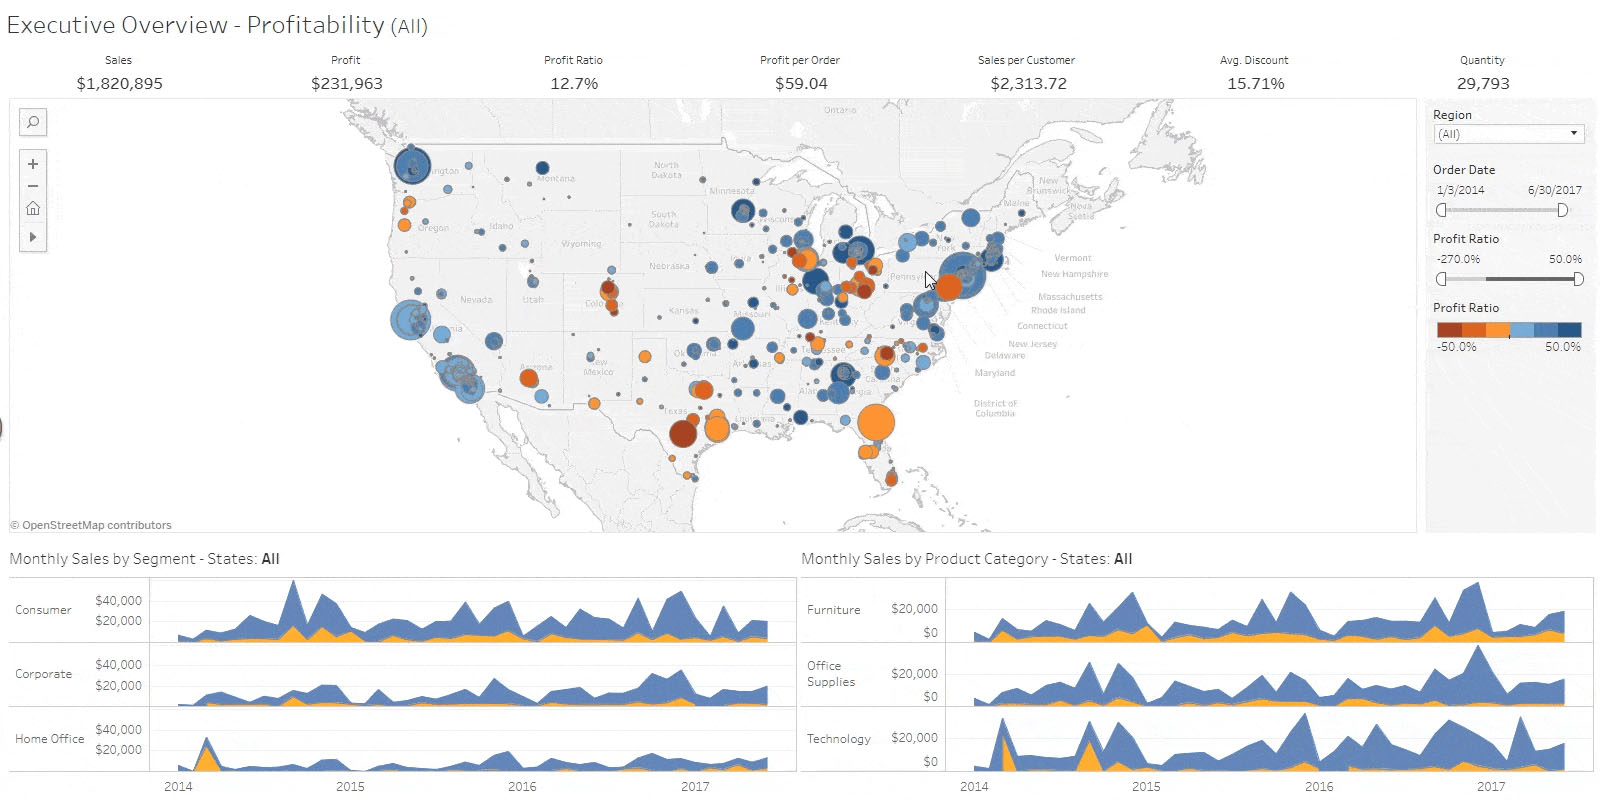
Data visualization, data structuring & modelling, and aggregation has always been strategic to an organization to capitalize data and make valuable decisions. Pukka Partners provides analytics, business intelligence, and data visualization services to its clients’ with an objective to communicate information precisely and efficiently via eye-catching dashboard using charts, plots and graphs that audience can easily understand.
Our expertise in interactive dashboard (Power BI and Tableau) and storytelling using data and insights help organization gain competitive edge, operational efficiency, customer & employee satisfaction, increasing revenue, and cost optimization.